Provenance Data
Provenance Data
Nifi maintains a very detailed level of detail about every piece of data it absorbs. As data is processed through the system and modified, routed, shared, aggregated, and distributed to other endpoints, all this information is stored in the Provenance Repository. To search and view this information, we can select Data Provenance from the Global Menu. This will give us a table listing the Provenance events we are looking for:
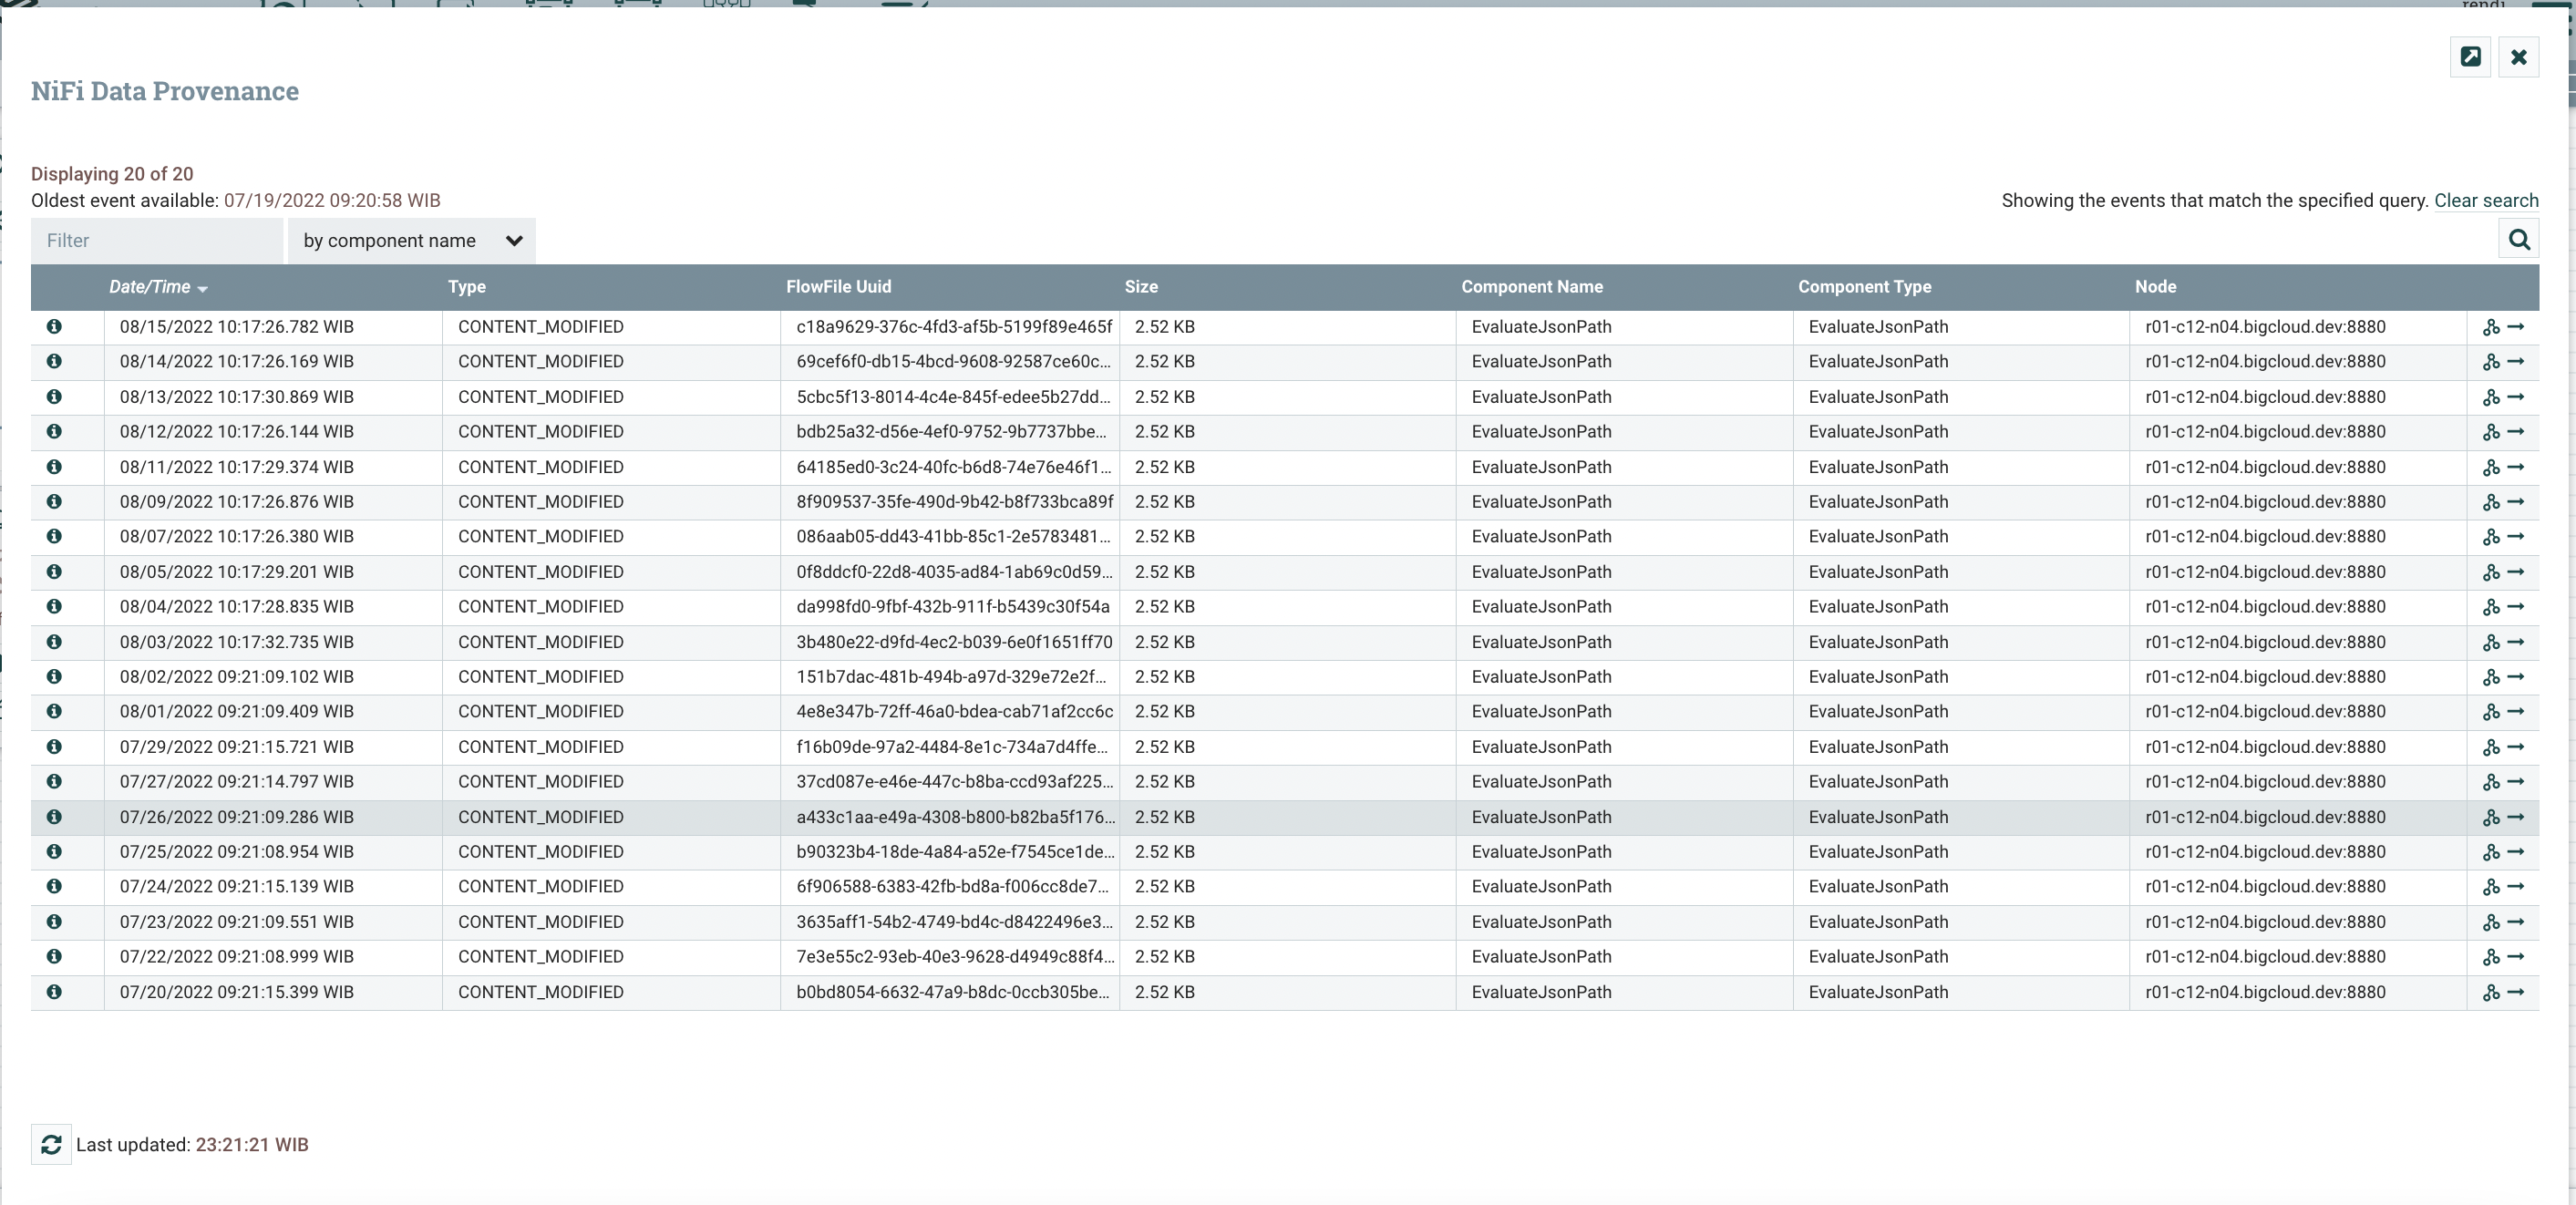
Initially, this table is populated with the most recent 1,000 provenance events that have occurred (though it may take a few seconds to process the information after the event has occurred). From this dialog, there is a Search button which allows the user to search for events that occurred by a specific Processor, for a specific FlowFile by filename or UUID, or some other field. The nifi.properties file provides the ability to configure which properties are indexed, or made searchable. Apart from that, the properties file also allows you to select specific FlowFile Attributes to index. As a result, you can choose which Attributes are important to your specific data stream and make those Attributes searchable.
Event Details
After performing a search, the table will be populated only with events that match the search criteria. From here, we can select the Info icon () on the left side of the table to see the details of the event:
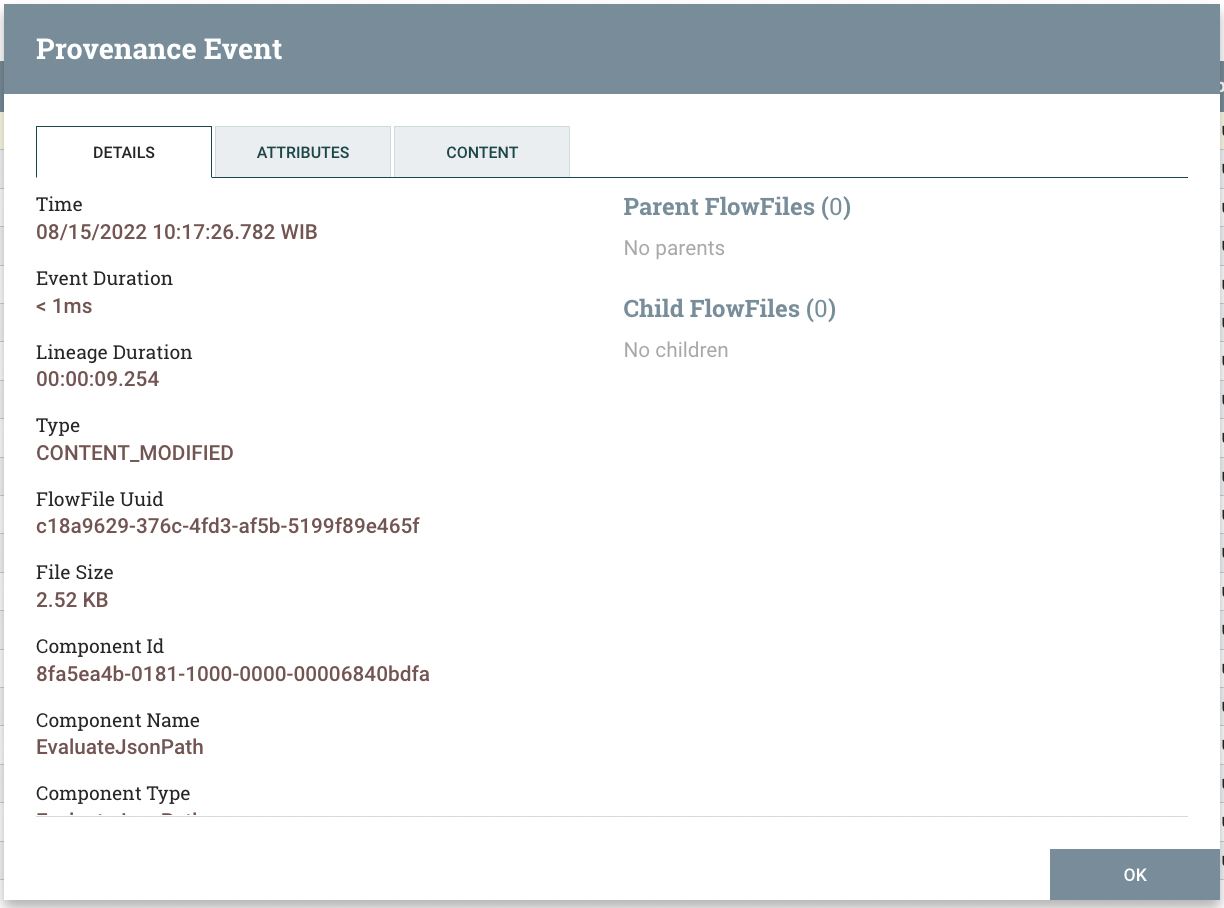
From here, we can see exactly when the event occurred, which FlowFile the event was affected by, which component (Processor, etc.) performed the event, how long the event lasted, and the entire time the data was in NiFi at the time of the event. occurs (total latency). The next tab provides a list of all the Attributes that were in the FlowFile at the time the event occurred:
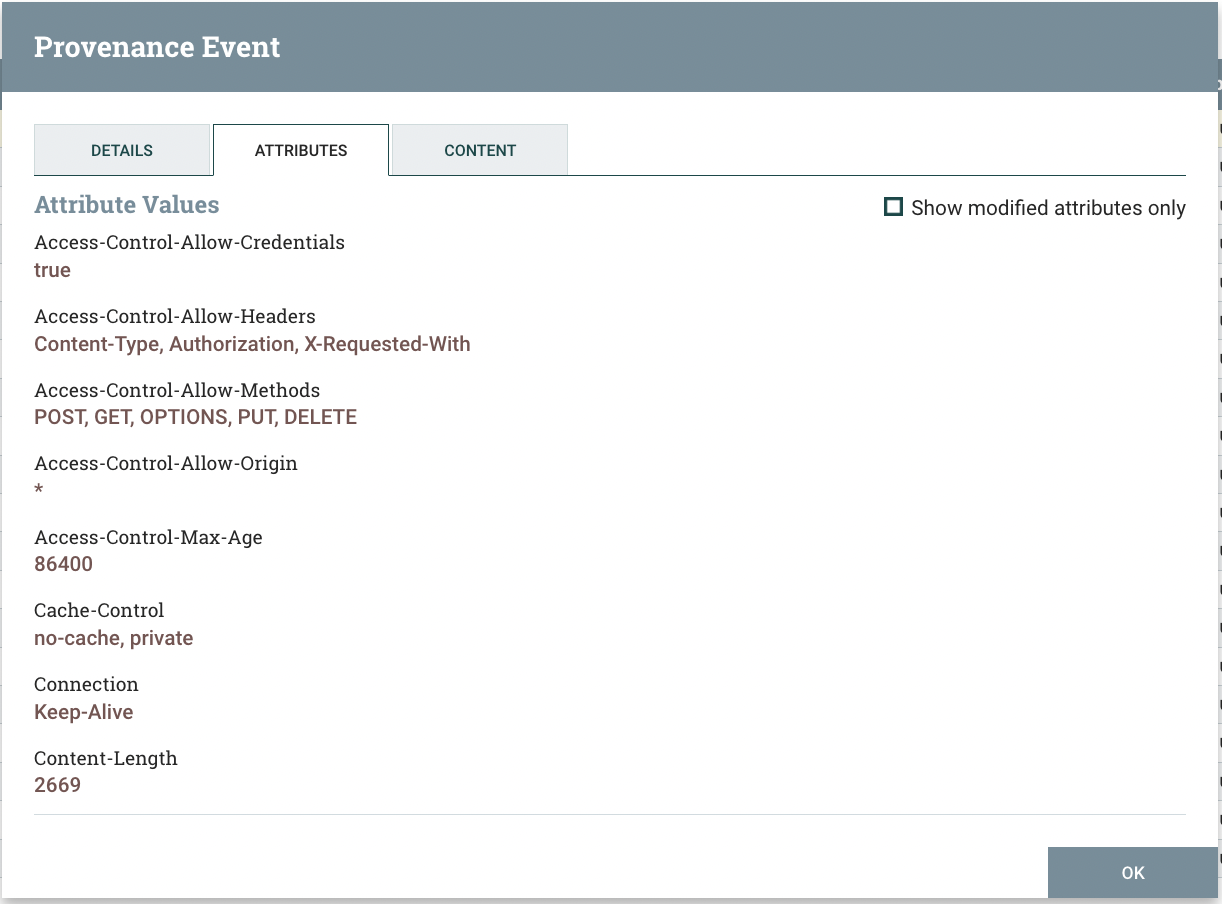
From here, we can see all the Attributes that were in the FlowFile when the event occurred, as well as the previous values for those Attributes. This allows us to know which Attributes changed as a result of this event and how they changed. Additionally, in the right corner is a checkbox that allows the user to view only the Attributes that have changed. This may not be very useful if the FlowFile has only a few Attributes, but it can be very helpful when the FlowFile has hundreds of Attributes.
This is very important because it allows the user to understand the exact context in which the FlowFile is processed. It's helpful to understand why FlowFiles are processed the way they are, especially when the Processor is configured using Expression Language. Lastly is the Content tab:
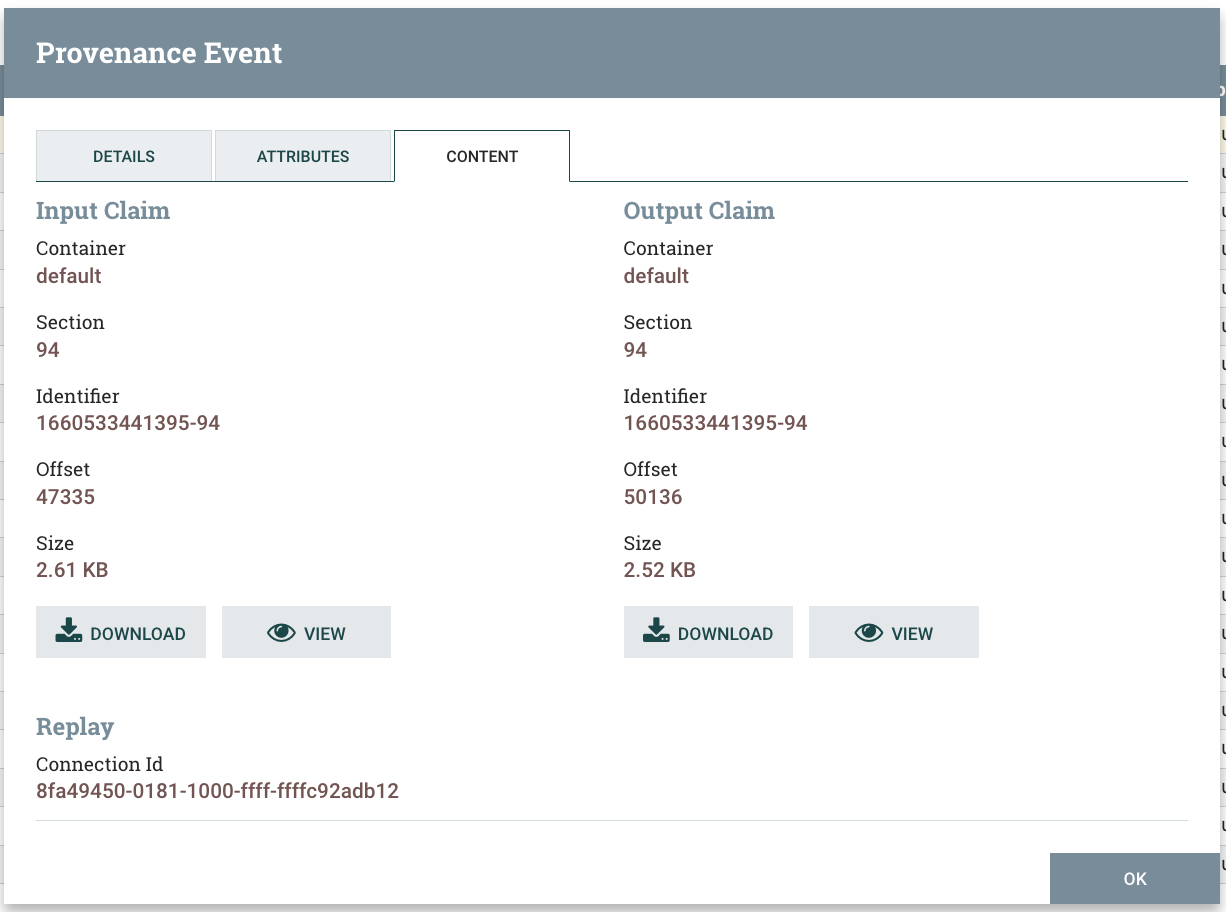
This tab provides information about where in the FlowFile Content Repository content is stored. If the event changes the content of the FlowFile, we'll see the content claims before (input) and after (output). We are then given the option to Download the content or to View the content within the NiFi itself, if the data format is one that NiFi understands how to render.
Additionally, in the Replay section of the tab, there is a Replay button that allows the user to reinsert the FlowFile into the stream and reprocess it from the point where the event occurred. It provides a very powerful mechanism, as it can modify the flow in real time, reprocess the FlowFile, and then view the results. If it's not as expected, we can modify the flow again, and reprocess the FlowFile again. We can iterate over this flow until it processes the data exactly as intended.
Graph Lineage
Apart from viewing Provenance event details, you can also view the involved FlowFile lineage by clicking the Lineage Icon () from the table view. This gives us a graphical representation of what happens to that piece of data as it traverses the system:
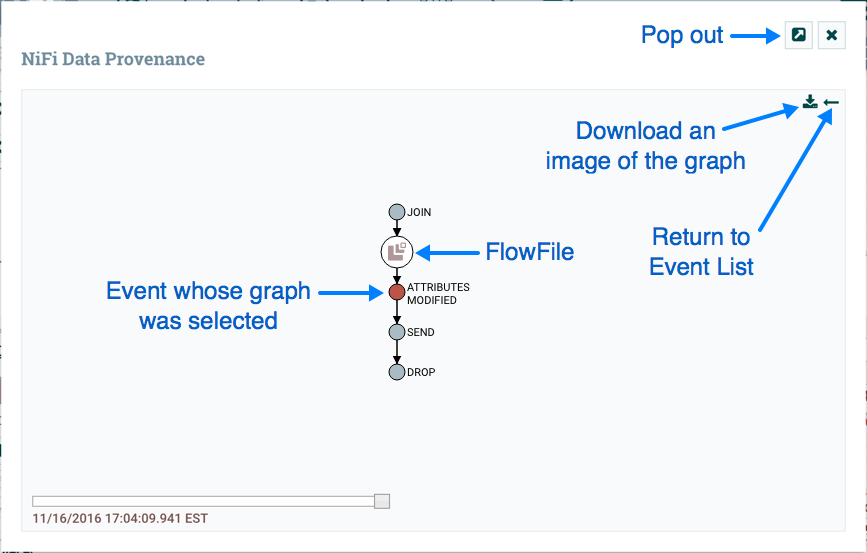
From here, we can right-click on any of the represented events and click the View Details menu item to view Event Details. This graphical representation shows us which events occur in the data. There are several types of "special" events to watch out for. If we see a JOIN, FORK, or CLONE event, we can right click and select Find Parents or Expand. This allows us to see the lineage of the parent FlowFiles and the created child FlowFiles as well.
The slider in the lower left corner allows us to see the time at which this event occurred. By swiping left and right, we can see which events are feeding latency into the system so we have a very good understanding of where in our system we may need to provide more resources, such as the number of Concurrent Tasks for the Processor. Or it might reveal, for example, that most of the latency is due to the JOIN event, which waits for more FlowFiles to join together. In both cases, the ability to easily see where this is happening is a very powerful feature that will help the user to understand how the process operates.