Monitoring BigAction
Monitoring BigAction
As data flows through data streams in BigAction, it is important to understand how well the system is performing to assess whether more resources are needed and to assess the current health of resources. BigAction provides several mechanisms for monitoring the system.
Status Bar
Near the top of the BigAction screen under the Component Toolbar is a bar known as the Status Toolbar. It contains some important statistics about the current health of the system. The number of Active processes can indicate how hard BigAction is currently working, and the Queue stat shows how many FlowFiles are currently queued across the flow, as well as the total size of those FlowFiles.
If the BigAction instance is in a cluster, we'll also see an indicator here that tells us how many nodes are in the cluster and how many are currently connected. In this case, the number of active processes and the size of the queue is an indication of the total number of all nodes currently connected.
Statistical Component
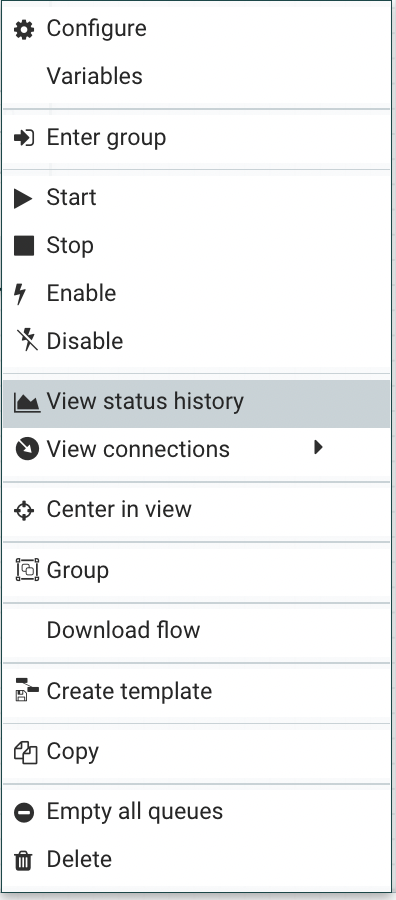
Each Processor, Process Group, and Remote Process Group on the canvas provides some statistics about how much data the component has processed. These statistics provide information about how much data has been processed in the last five minutes. This is a scrolling window and allows us to see things like the number of FlowFiles the Processor has consumed, as well as the number of FlowFiles the Processor has emitted. Connections between Processors also expose the number of items being queued. It may also be helpful to look at the historical values for these metrics and, when grouped, how the different nodes compare to one another. To view this information, we can right-click on the component and select the View status history menu item.

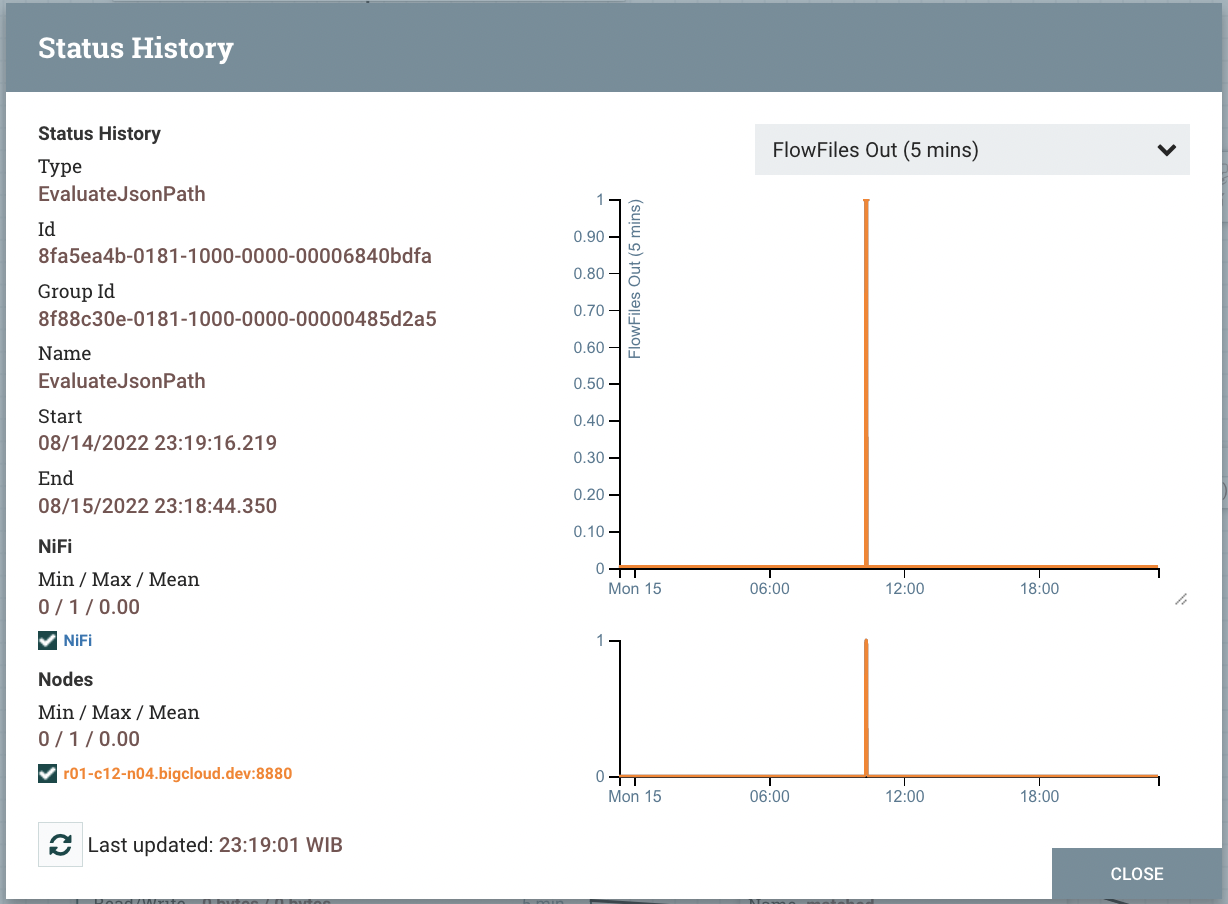
This will show us a graph that includes the time since BigAction started, or up to 24 hours, whichever is less. The amount of time shown here can be extended or reduced by changing the configuration in the properties file.
In the upper-right corner of this dialog is a drop-down that lets users choose which metrics they are looking at. The graph at the bottom allows the user to select a smaller portion of the graph to zoom in on.

Bulletin
In addition to the statistics provided by each component, users will want to know if any problems occur. While we can monitor the logs for things of interest, it would be easier if a notification popped up on the screen. If the Processor records something as a WARNING or an ERROR, we will see a "Bulletin Indicator" appear in the upper right corner of the Processor. This indicator looks like a sticky note and will be displayed for five minutes after the event occurs. Hovering over the newsletter provides information about what happened so users don't have to sift through log messages to find it. If in a cluster, the bulletin will also indicate which node in the cluster issued the bulletin. We can also change the log level at which the newsletter will appear in the Settings tab of the Configuration Dialog for Processors.
