Monitoring Machine Metrics
Monitoring Machine Metrics
Navigating service pages

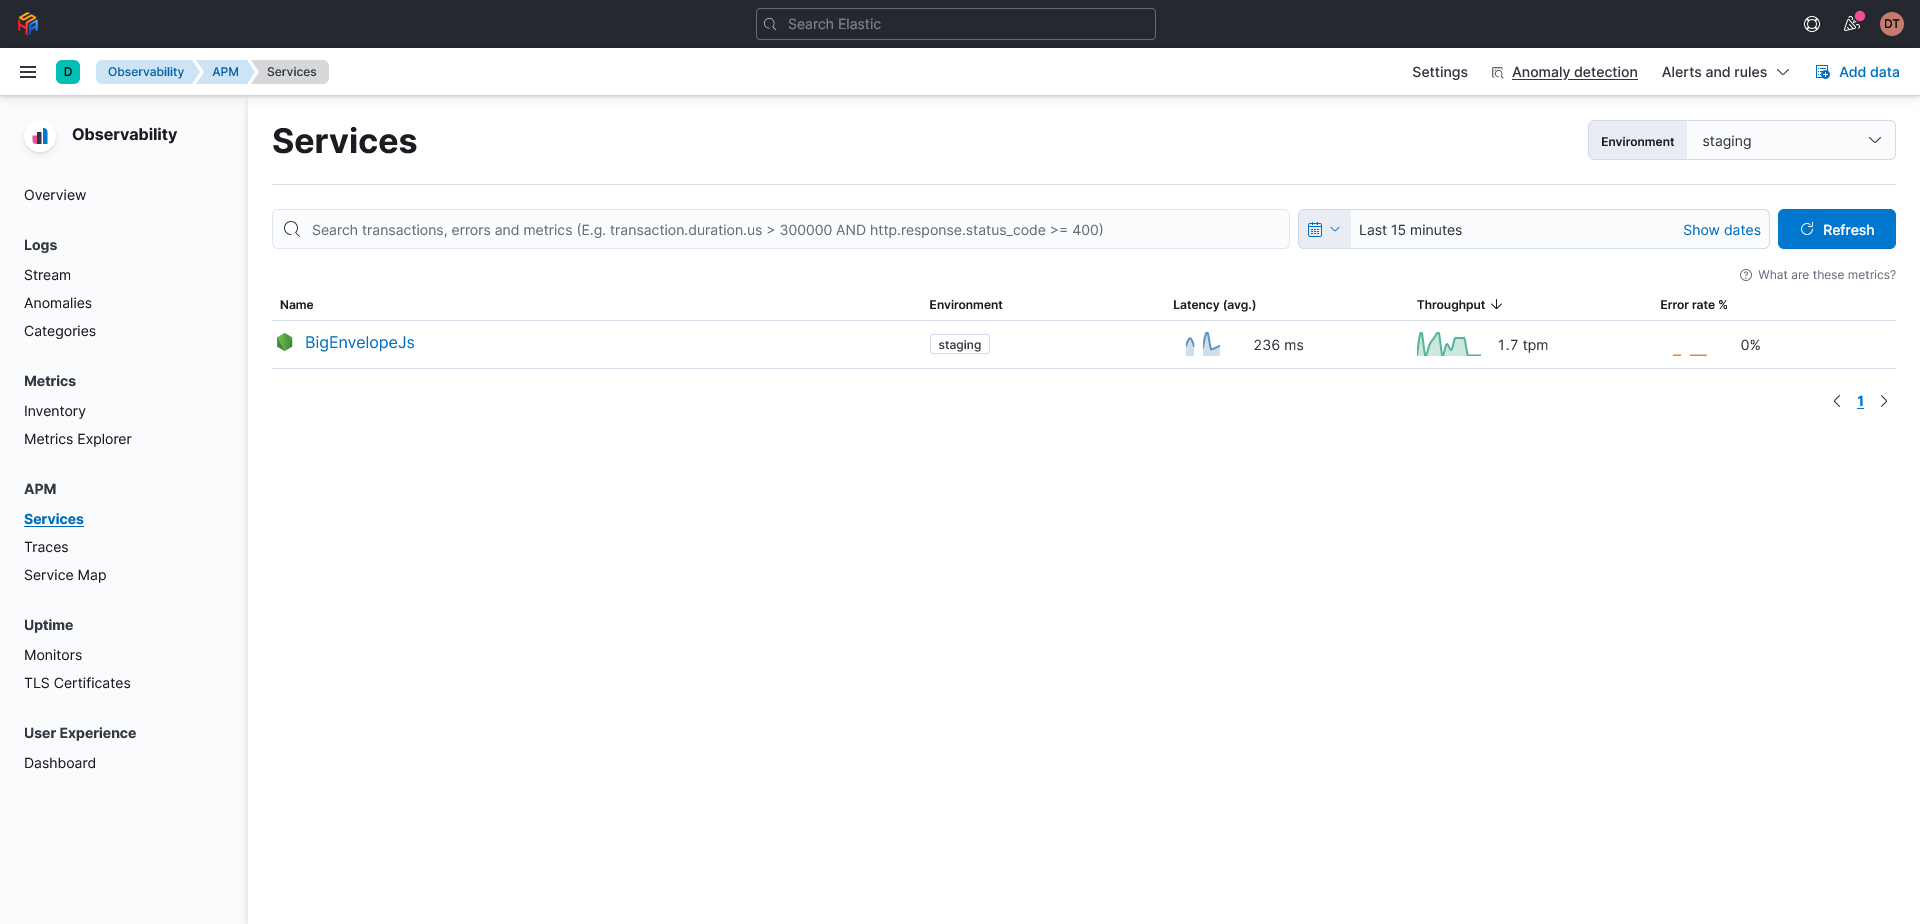
After logging in to the monitoring page. Click the “BigEnvelopeJs” service to enter the BigEnvelope service monitoring dashboard.

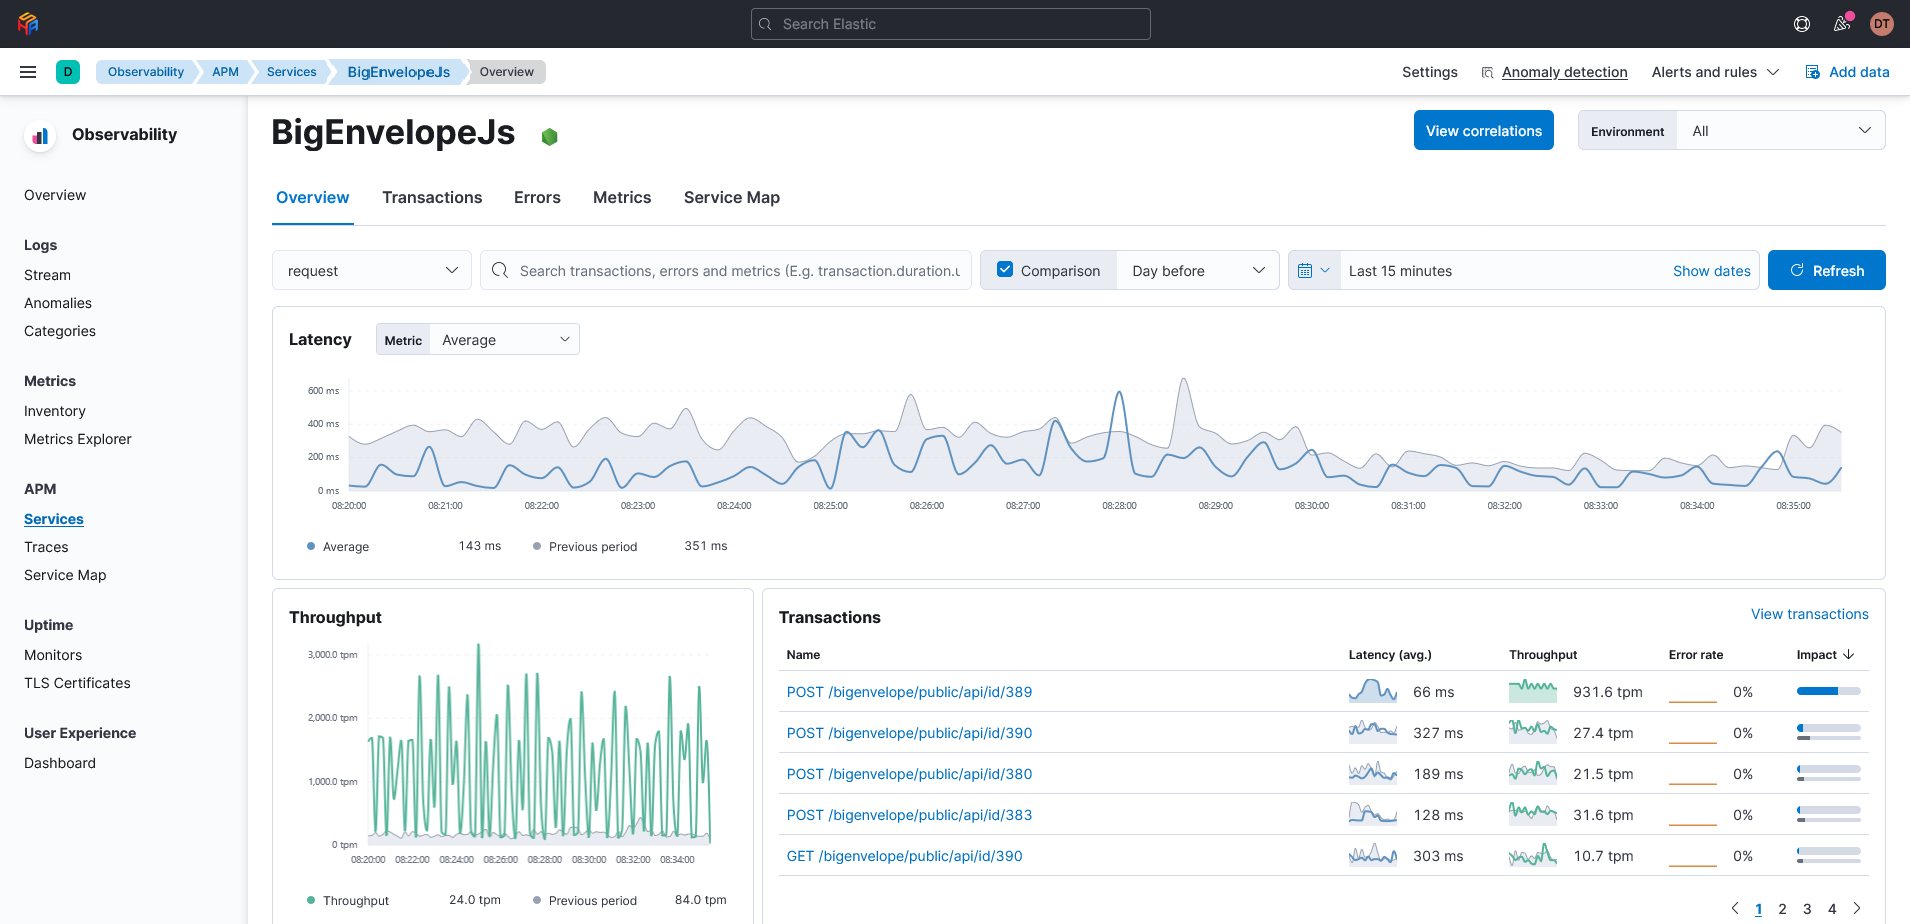
In the overview menu, users can see a summary of the latency, throughput, error rate, instances, and other statistics of all APIs handled by the BigEnvelope service. Users can filter api id, consumer, ip, etc. using filter input. Users can also adjust the duration of the data displayed by the graph by adjusting the time filter.
Navigating Metrics page
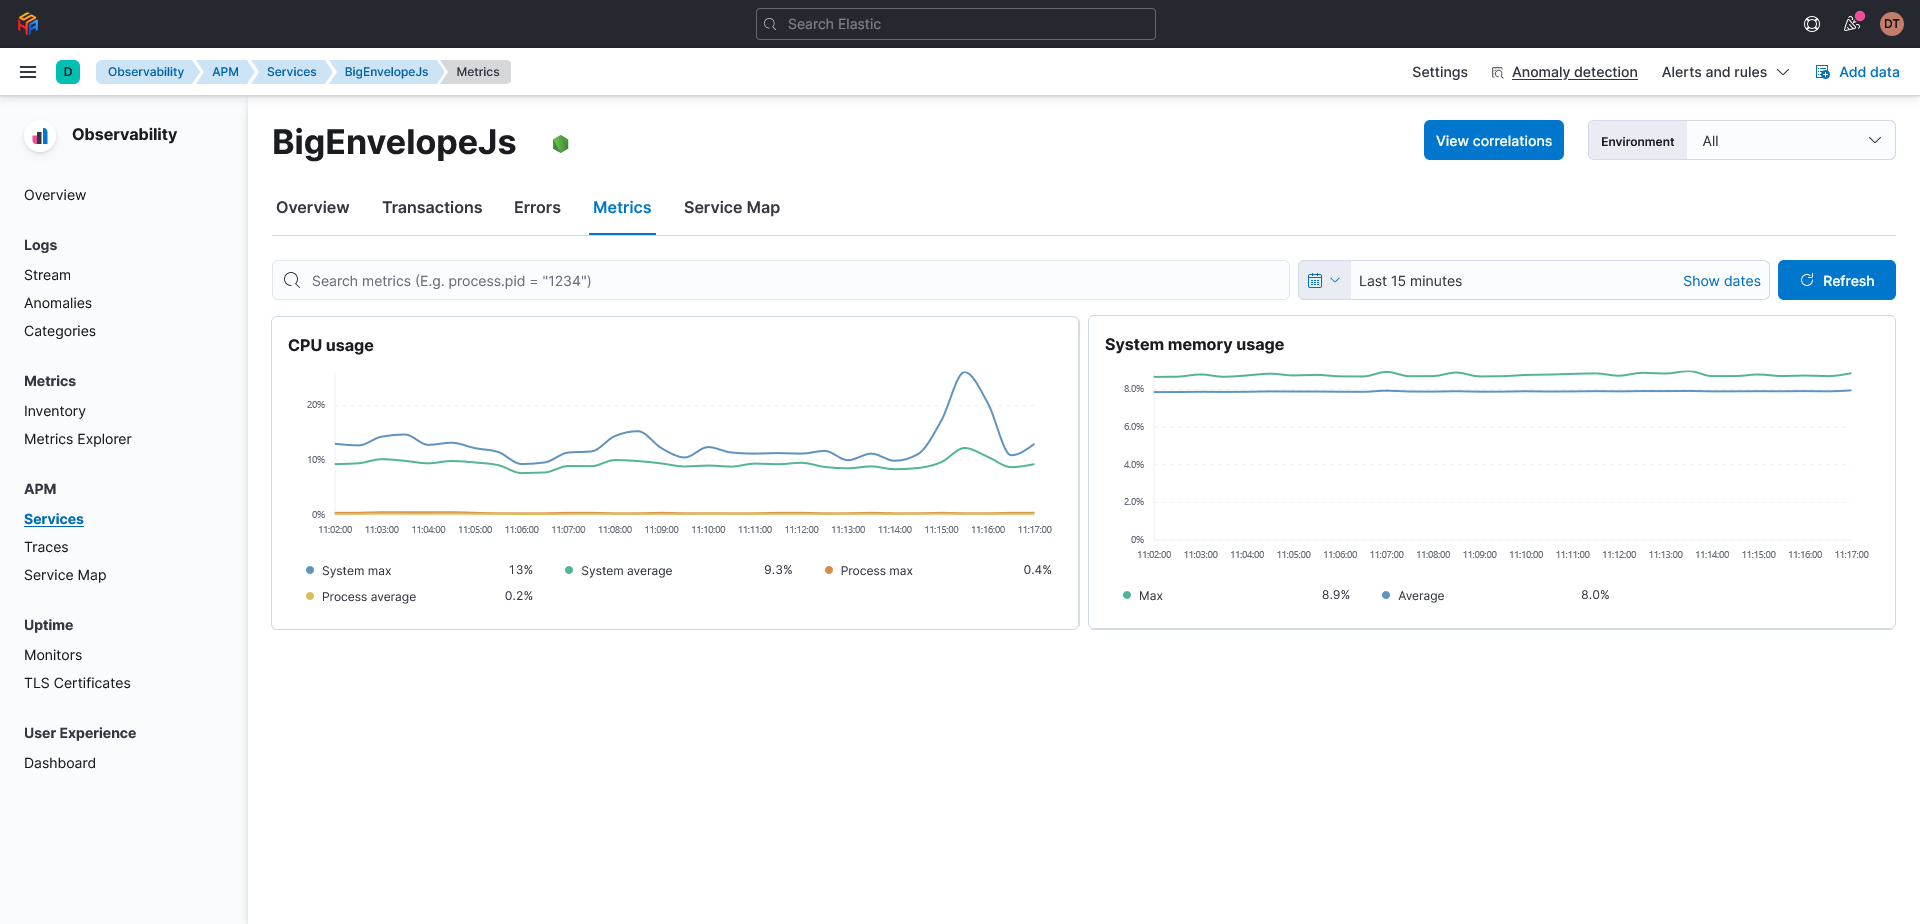
Click the metrics button to see the machine resource graph used by the BigEnvelope service. The resource displayed is a representation of the CPU and memory usage by the machine
