Overview
Overview
Overview
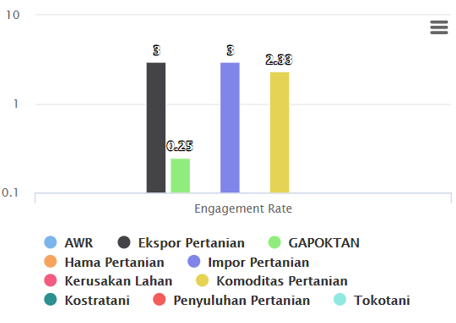
Visualization on BigSocial is designed for personal, business, organizational, brand or company needs to read and gain insight more easily. The visualization consists of comparative data, trends, sentiments, detailed data, interaction/engagement, and common themes.
- Trend analysis, showing fluctuations in data based on a predetermined period of time to facilitate monitoring.

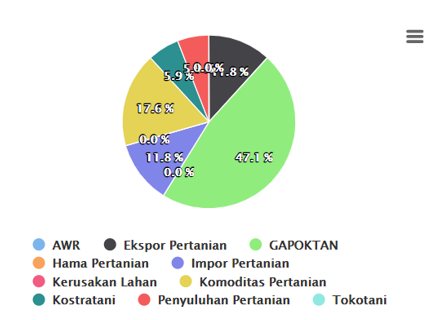
- The comparison portlet shows the comparison in percentage to make it easier for users to see the comparison of each topic.
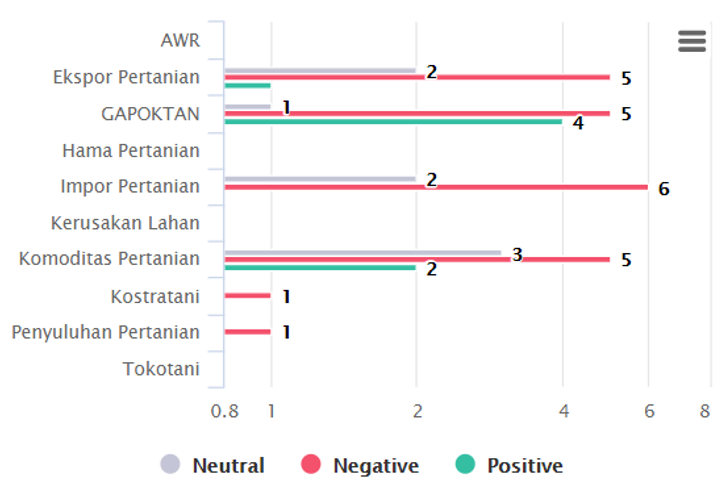
- Sentiment portlets, sentiment indicators on social media/digital media data can be used to describe public opinion on predetermined topics.
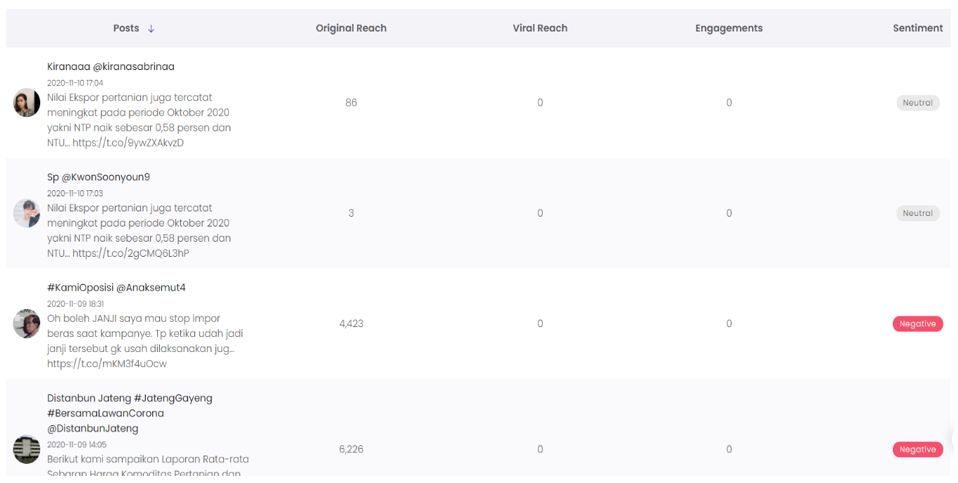
- Data breakdown, detailed data on each news. There are indicators for each news that is displayed, with the details of the data being more optimal in analyzing the topic.
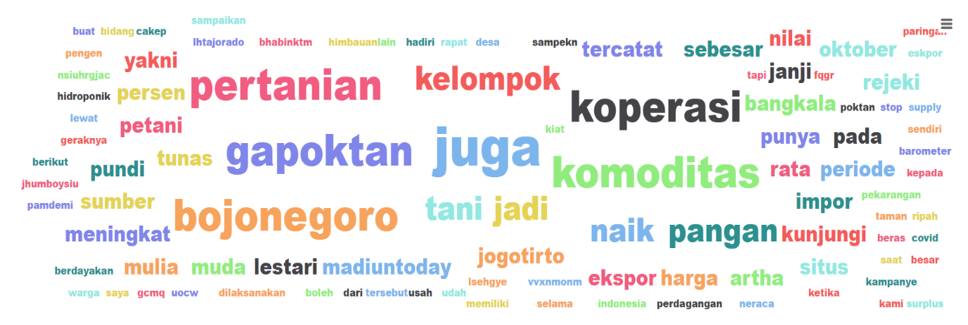
- Common themes, show the most significant discussion/opinion on social media/digital media.
